Research Stories

Millions turn to voting advice apps. Do they change anything?

At a time when the internet gets much of the blame for what is going wrong with democracy, voting advice applications stand out. We pooled every study we could find on what they actually do. The answer depends on how you look.

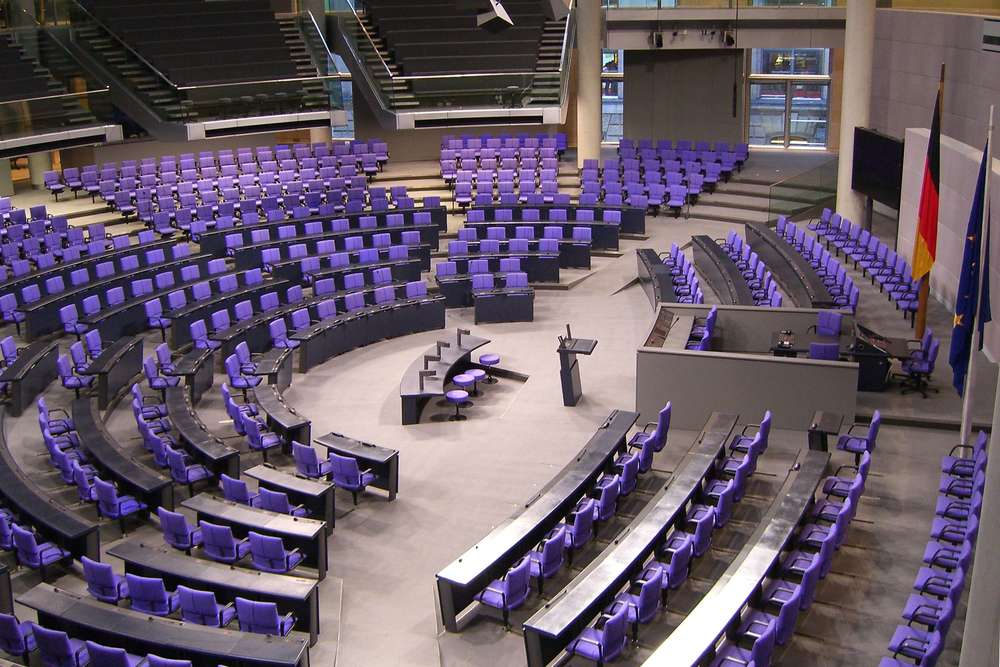
The plenary hall of the German Bundestag in Berlin, seen from the side.
Photo: Times, CC BY-SA 3.0

Every election season, millions of people turn to online tools for voting advice. In Germany it's the Wahl-O-Mat, in the Netherlands StemWijzer, in Switzerland smartvote. Researchers call them voting advice applications, or VAAs. The first ones appeared in the Netherlands more than three decades ago, on floppy disk.

They promise to help people make sense of a crowded field of parties, and maybe even get them to the polls.

But do they deliver? Do people vote because of them? Do they vote differently? Do they learn where the parties stand?

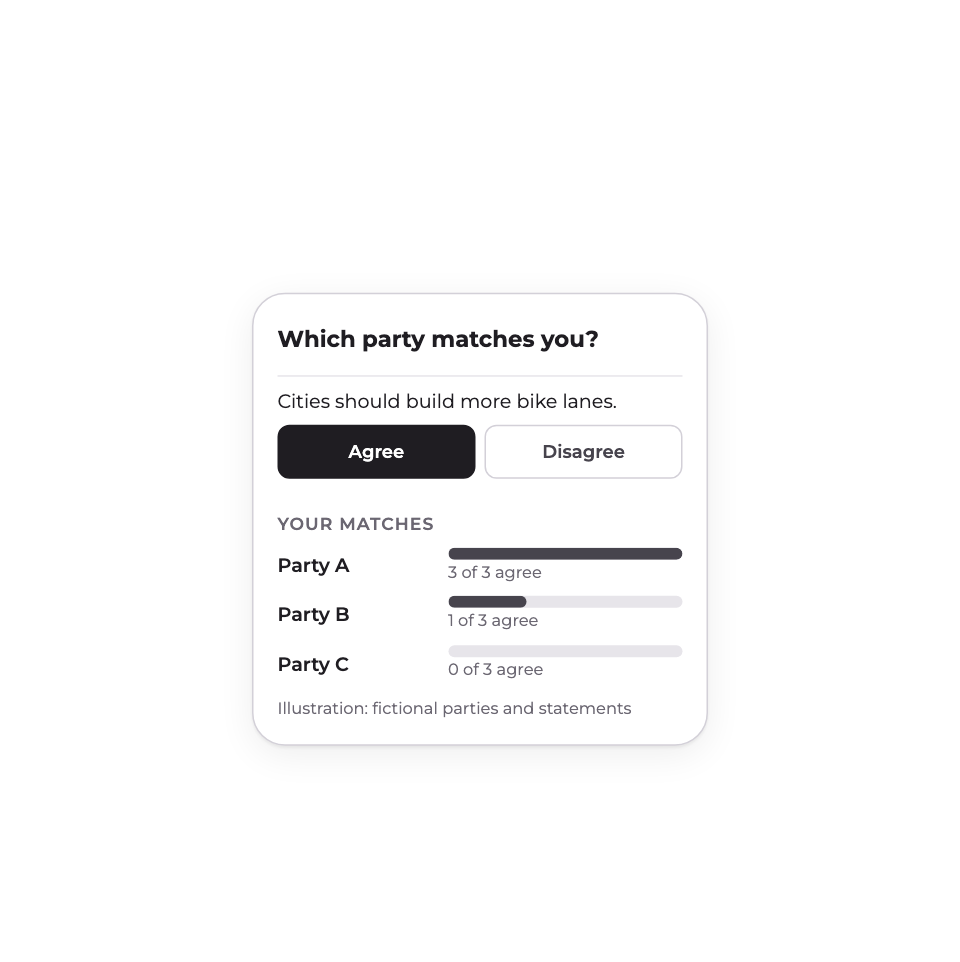
Graphic: A stylized phone screen showing a voting quiz. One policy statement, agree and disagree buttons, and a ranked list of fictional parties with bars showing how well each one matches.

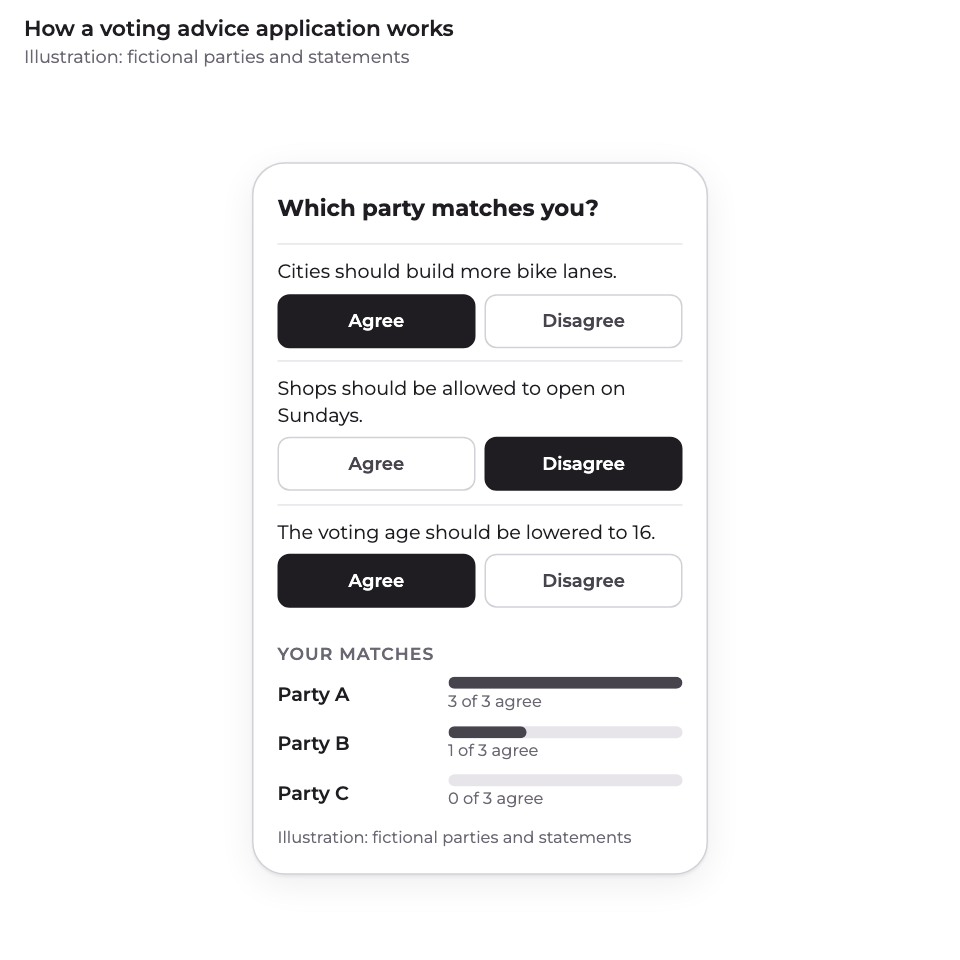
Here is how a VAA works. You say whether you agree or disagree with each statement. The tool compares your answers with the parties' positions. Then it ranks the parties by how well they match you. (Of course, each VAA has its own design features and does things a little differently, but the general logic is the same.)

It doesn't tell you to vote. It shows you which parties sit closest to your answers, and leaves the rest to you. Germany's Federal Agency for Civic Education, which runs the Wahl-O-Mat, stresses that the result is not a voting recommendation.

Graphic: Illustration with fictional content. Three statements, each answered agree or disagree. Below, three fictional parties with bars showing how closely each matches the answers. The party that agrees most often is ranked first.

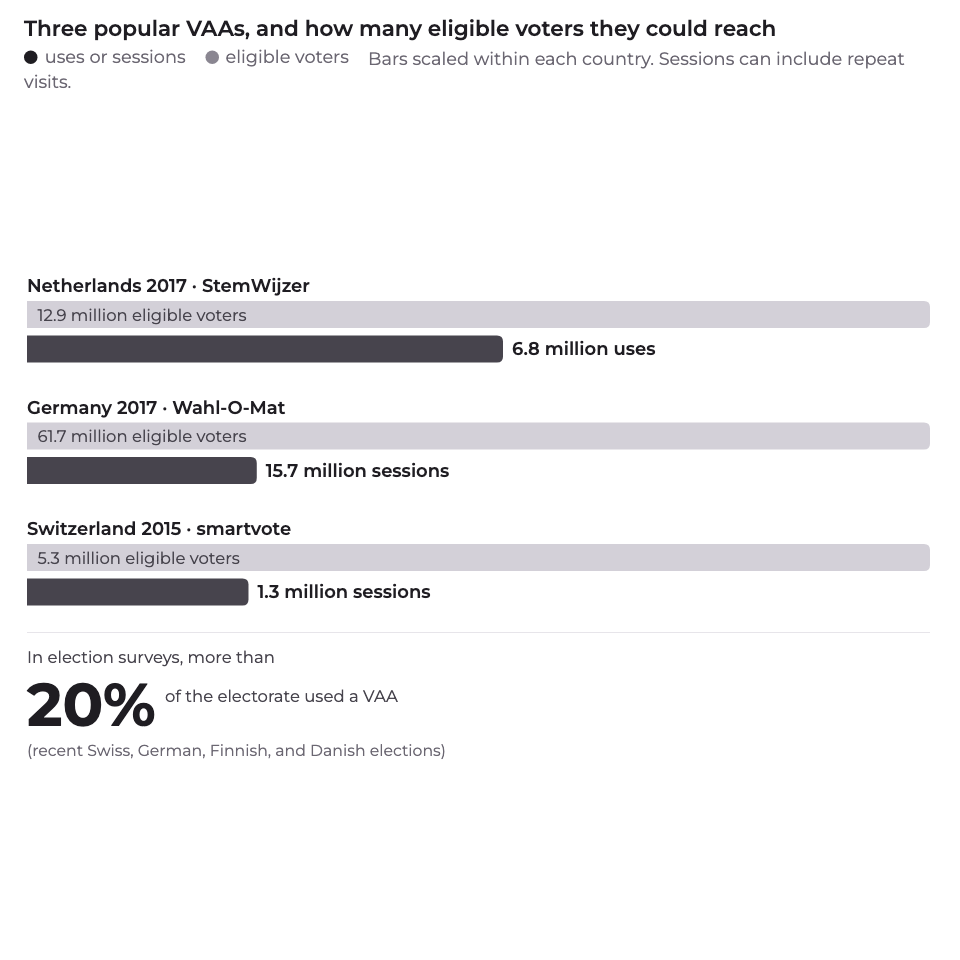
These are not niche tools. At the 2017 Dutch election, StemWijzer was used 6.8 million times, in a country with 12.9 million eligible voters. Germany's Wahl-O-Mat logged 15.7 million sessions that year.

Session counts include repeat visits, so they probably overstate the number of people. Still, that is a lot of people. Election surveys tell a similar story: more than 20% of the electorate used a VAA in recent Swiss, German, Finnish, and Danish elections, according to the work we reviewed. Newer figures are higher still: more than half of voters turned to one before recent elections in the Netherlands, Denmark, Norway, and Sweden.

Parties notice, too: they now pay close attention to how the tools present them. With that many users, even a small effect could add up.

Graphic: Bar pairs for three elections. Netherlands 2017: StemWijzer used 6.8 million times, against 12.9 million eligible voters. Germany 2017: Wahl-O-Mat, 15.7 million sessions, against 61.7 million eligible voters. Switzerland 2015: smartvote, 1.3 million sessions, against 5.3 million eligible voters. A note says sessions can include the same person more than once.

Researchers have (broadly) asked three questions about VAAs. Do users turn out to vote more? Do they change whom they vote for? Do they learn where the parties stand?

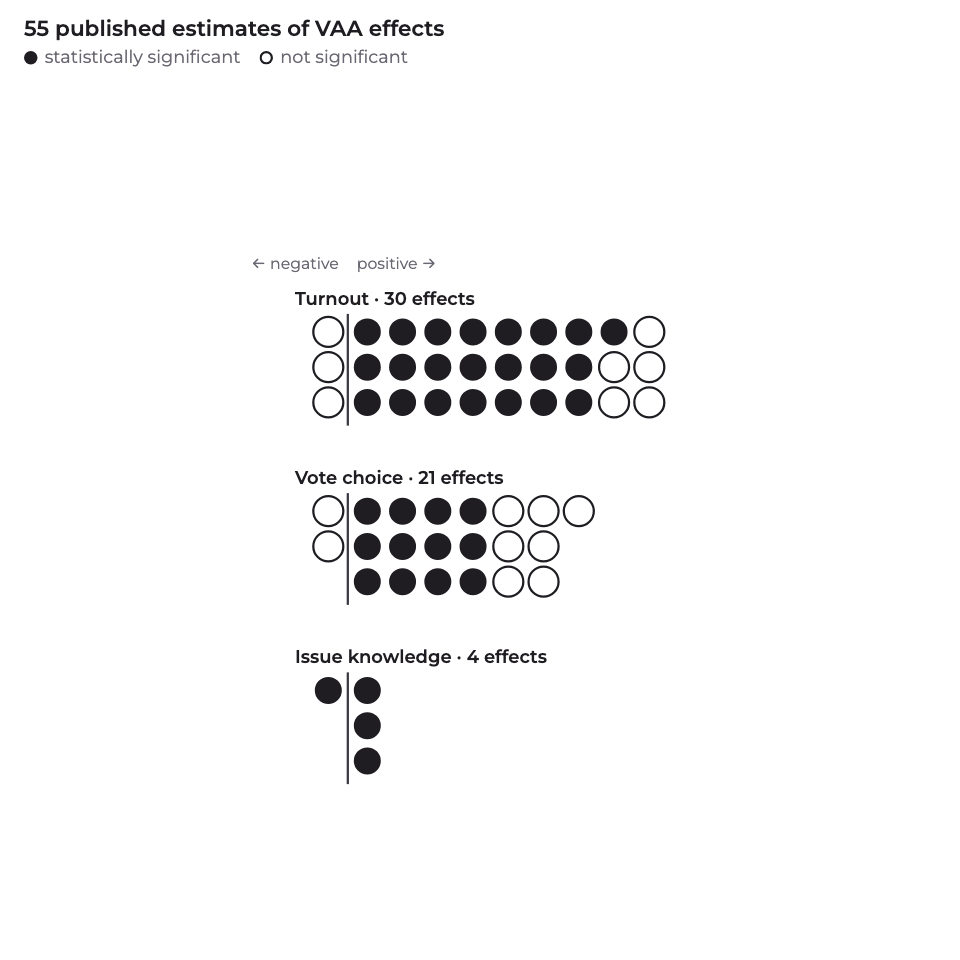
Each dot here is one answer: one estimate, from one study, for one election. Of the 55 we collected, 49 point the same way. VAA users vote more, switch more, or know more. 37 of them are statistically significant.

Read the literature one paper at a time, and the answer looks like a clear yes.

Graphic: 55 dots, one per published estimate, in three rows: turnout (30), vote choice (21), issue knowledge (4). Dots to the right of a center line are positive, dots to the left are negative. Filled dots are statistically significant, hollow ones are not. 49 dots are on the positive side, and 37 of them are filled.

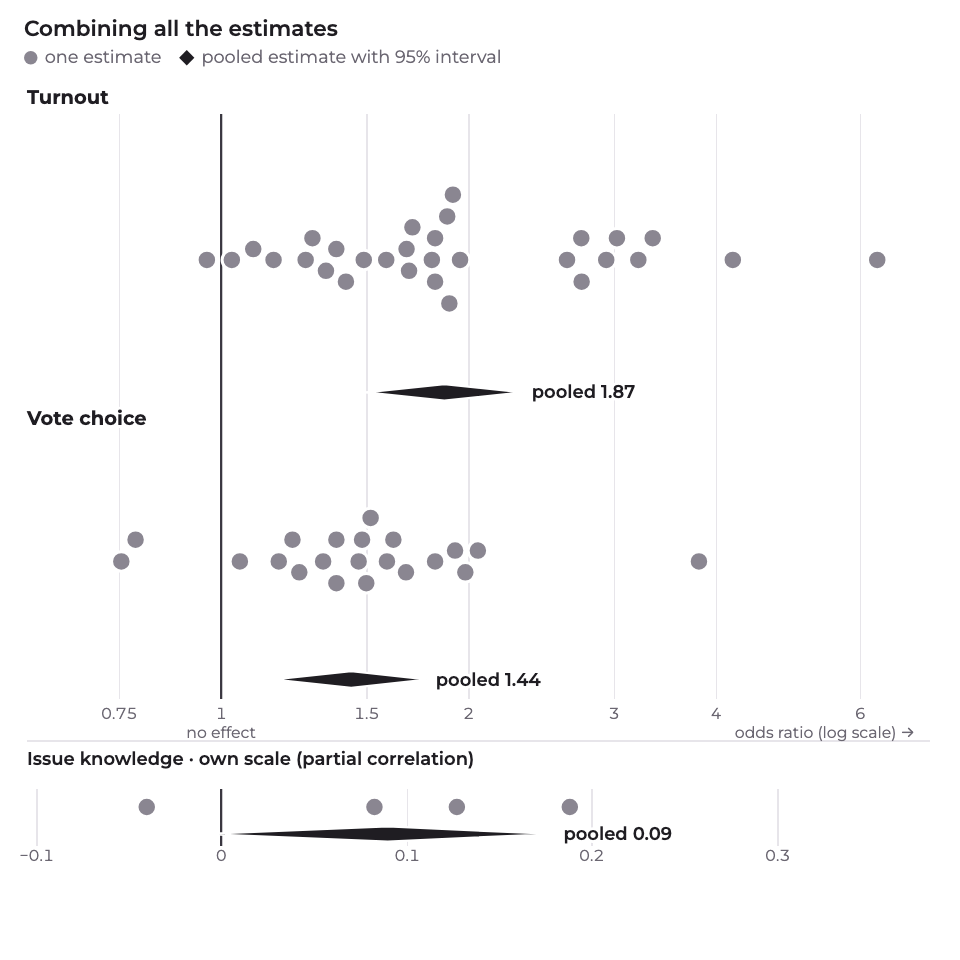
Then we combined them. A meta-analysis gives more weight to more precise estimates. Ours also accounts for studies that report several elections, and for elections that show up in several studies.

A quick note on the scale. An odds ratio compares the odds of doing something for VAA users and non-users. At 1 there's no difference. At 2, users' odds are twice as high.

For turnout, the pooled odds ratio is 1.87 (95% confidence interval: 1.50 to 2.33). Put plainly, VAA users' odds of voting are about 90% higher than non-users'.

For vote choice, it is 1.44 (1.16 to 1.78). Users' odds of changing their vote are about 44% higher.

Issue knowledge is measured differently, so it sits on its own scale at the bottom. We come back to it next.

Graphic: The dots line up on a horizontal scale of odds ratios, with a dashed line at 1 meaning no effect. Turnout row: 30 dots, nearly all to the right of 1, with a diamond for the pooled estimate at 1.87. Vote choice row: 21 dots, with a pooled diamond at 1.44. A small separate panel shows the 4 knowledge estimates on their own scale, with a pooled value of 0.09 whose range crosses zero.

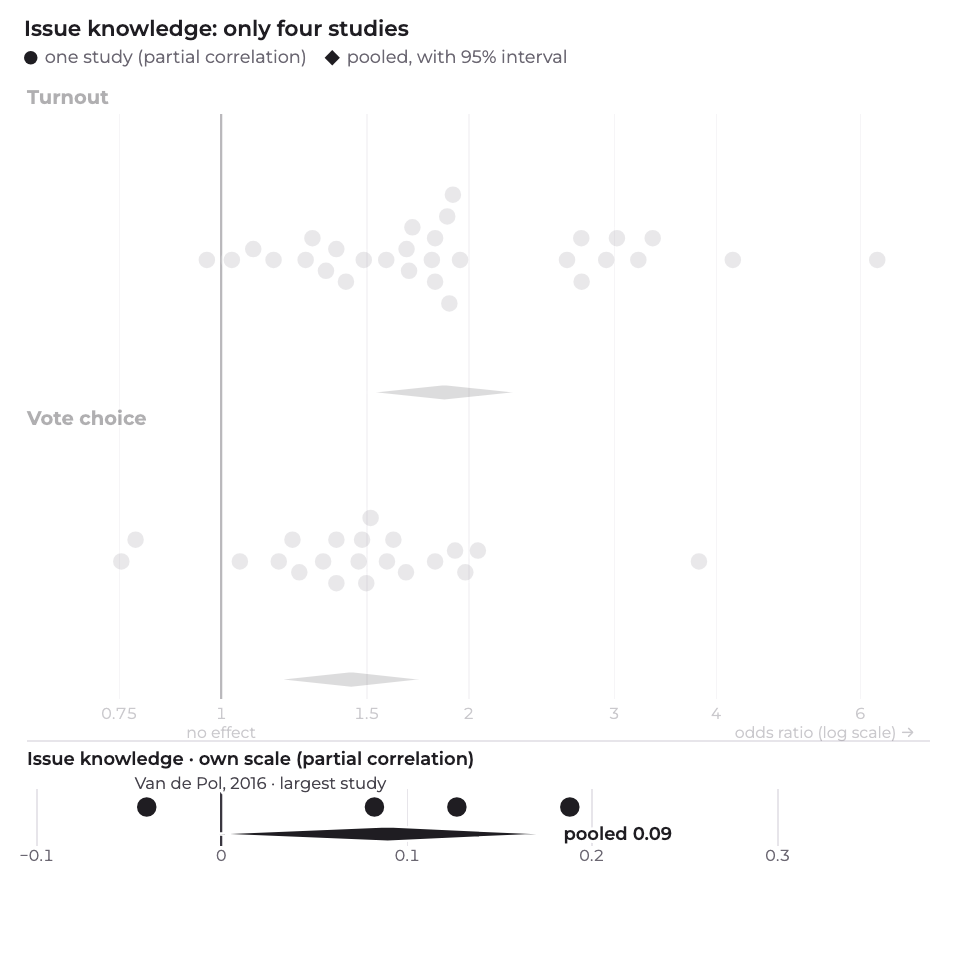
Issue knowledge deserves a closer look. VAAs are built to inform: their whole job is to show you where the parties stand. If they change anything, it should be this, first. Any effect on turnout or vote choice would follow from it.

Yet when we searched, only four studies had measured it. Three out of four found that users knew more about the parties' positions afterwards. The fourth, the largest of the four, found a small negative effect.

One of the four is by Simon Munzert himself, my co-author on this meta-analysis, together with Pablo Barberá, Andy Guess, and JungHwan Yang. During the 2017 German federal election campaign, they randomly encouraged more than a thousand people to use the Wahl-O-Mat, and recorded their actual use on their computers and phones. Using it did not detectably change whether or how they voted. But those who used it learned where the parties stood on its statements. The gain was about as large as the gap between someone moderately and someone strongly interested in politics.

Because the studies measure knowledge on different scales, we compare them as partial correlations: 0 means no relationship, and positive values mean users know more. Pooled, the effect is 0.09 (−0.01 to 0.18). That range includes zero.

On the outcome VAAs are designed for, there was the least to go on.

Graphic: Same chart, with turnout and vote choice faded. The four issue-knowledge estimates are highlighted on their own scale of partial correlations, with zero lined up under "no effect" above. Three sit above zero. One, from the largest of the four studies, sits just below. The pooled estimate is 0.09, with a range from −0.01 to 0.18.

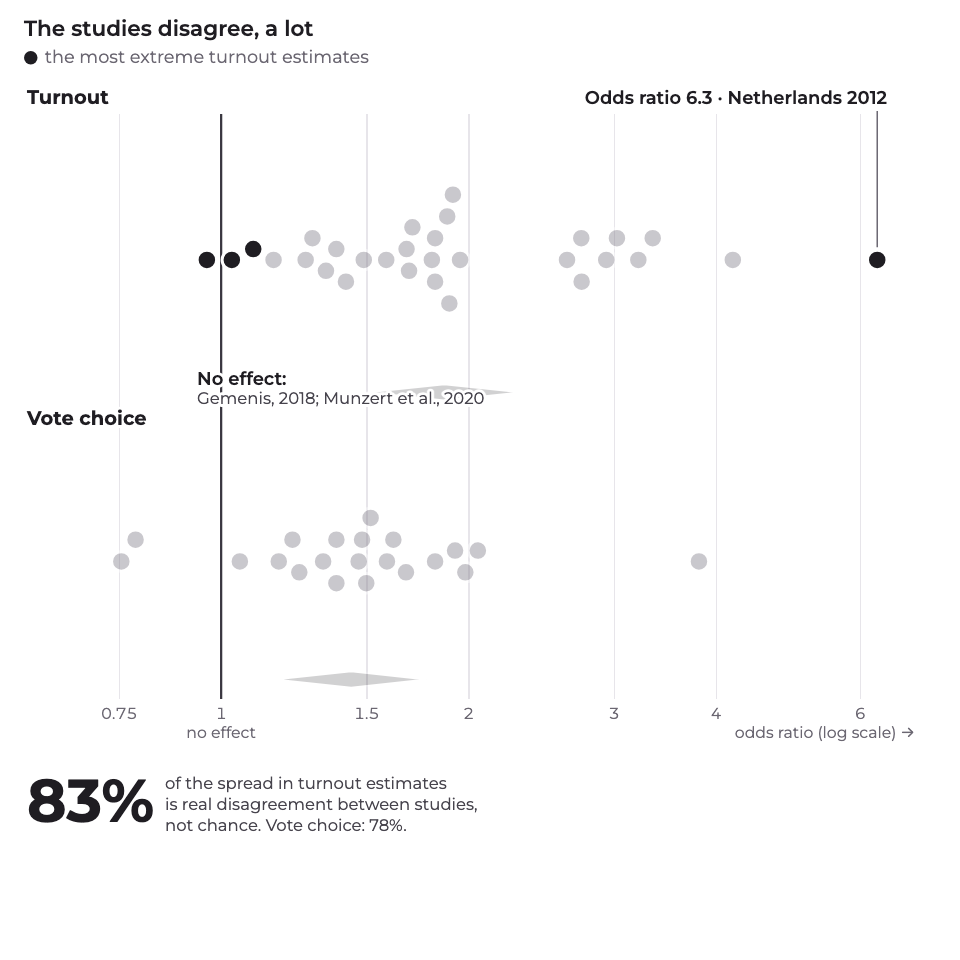
That average hides a lot of disagreement.

For turnout, the estimates range from no effect at all up to an odds ratio of 6.3, for the 2012 Dutch election.

Chance alone can't produce a spread like this. By a standard measure (I²), about 83% of the variation in turnout estimates reflects real differences between studies, not random noise. For vote choice, it's 78%.

So the studies aren't measuring one effect with some error. They are finding different things. Why?

Graphic: Same chart as before, with the pooled diamonds faded. The lowest and highest turnout estimates are highlighted. On the left, two studies near 1, meaning no effect. On the far right, the 2012 Dutch election, at an odds ratio of 6.3. A label reads: 83% of the variation is real disagreement, not chance.

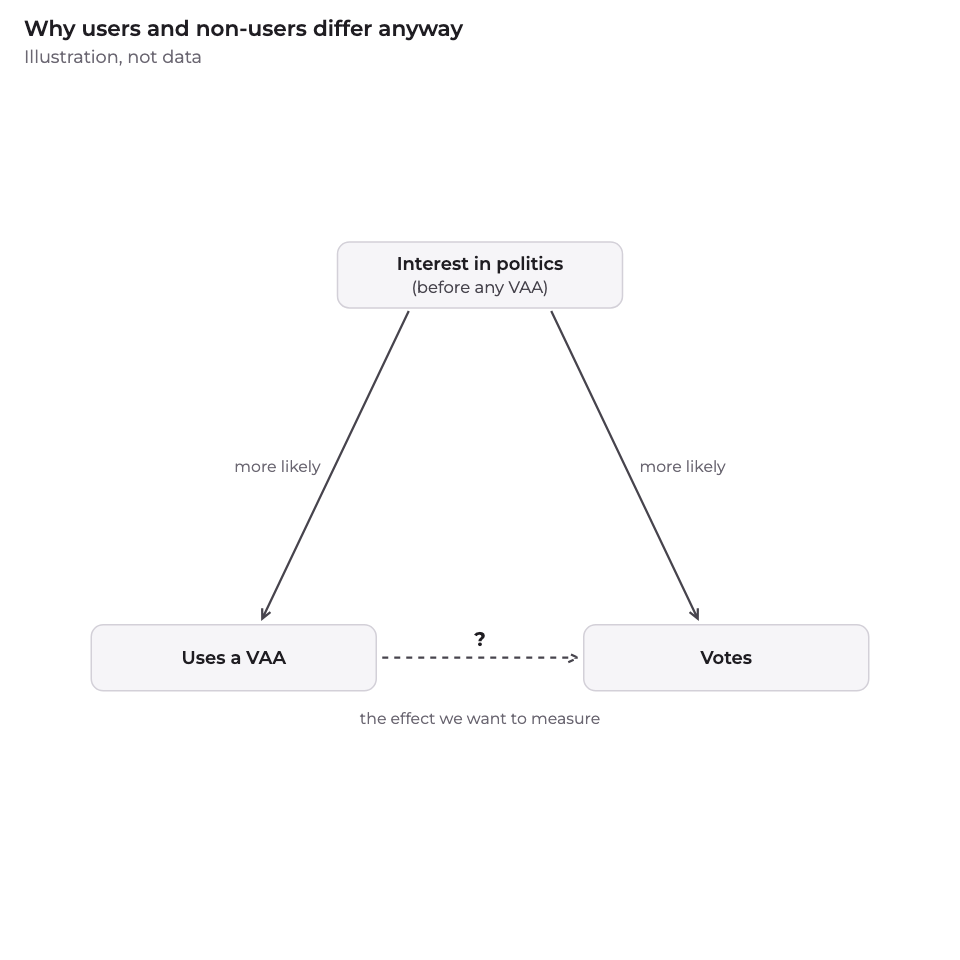
One suspect stands out. People who use VAAs are not a random slice of voters. They tend to care more about politics to begin with. And people who care about politics vote more, whatever they do online.

So if you compare users with non-users, part of the gap was there before anyone opened the app. Researchers call this self-selection. Unless a study deals with it, the effect of the app and the effect of being the kind of person who uses it get mixed up.

Graphic: Illustration, not data. Three boxes. Arrows lead from "interest in politics (before any VAA)" to both "uses a VAA" and "votes", each marked "more likely". A dashed arrow from "uses a VAA" to "votes" carries a question mark and the label "the effect we want to measure".

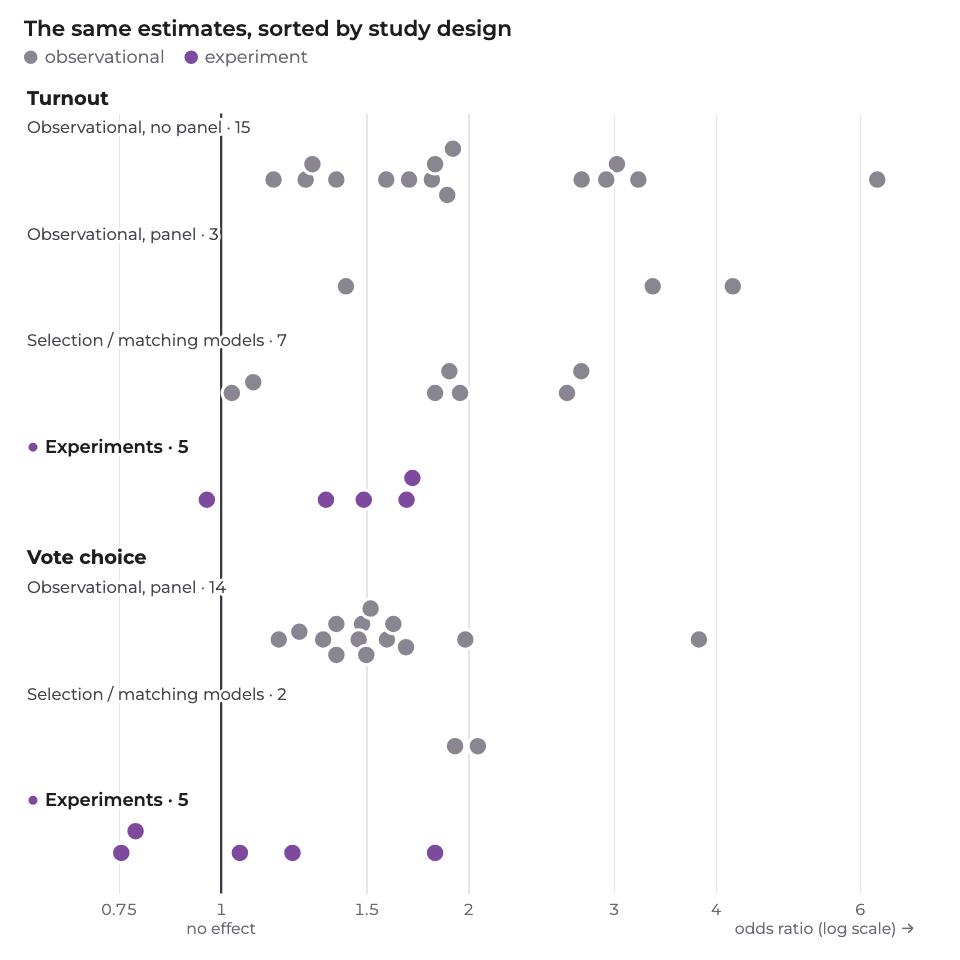
Studies deal with self-selection to very different degrees. We sorted them into four groups:

  • Observational, no panel. Users and non-users are compared once, after the election.
  • Observational, panel. The same people are asked before and after, so we can see change.
  • Selection and matching models. Statistical adjustments try to compare users with similar non-users.
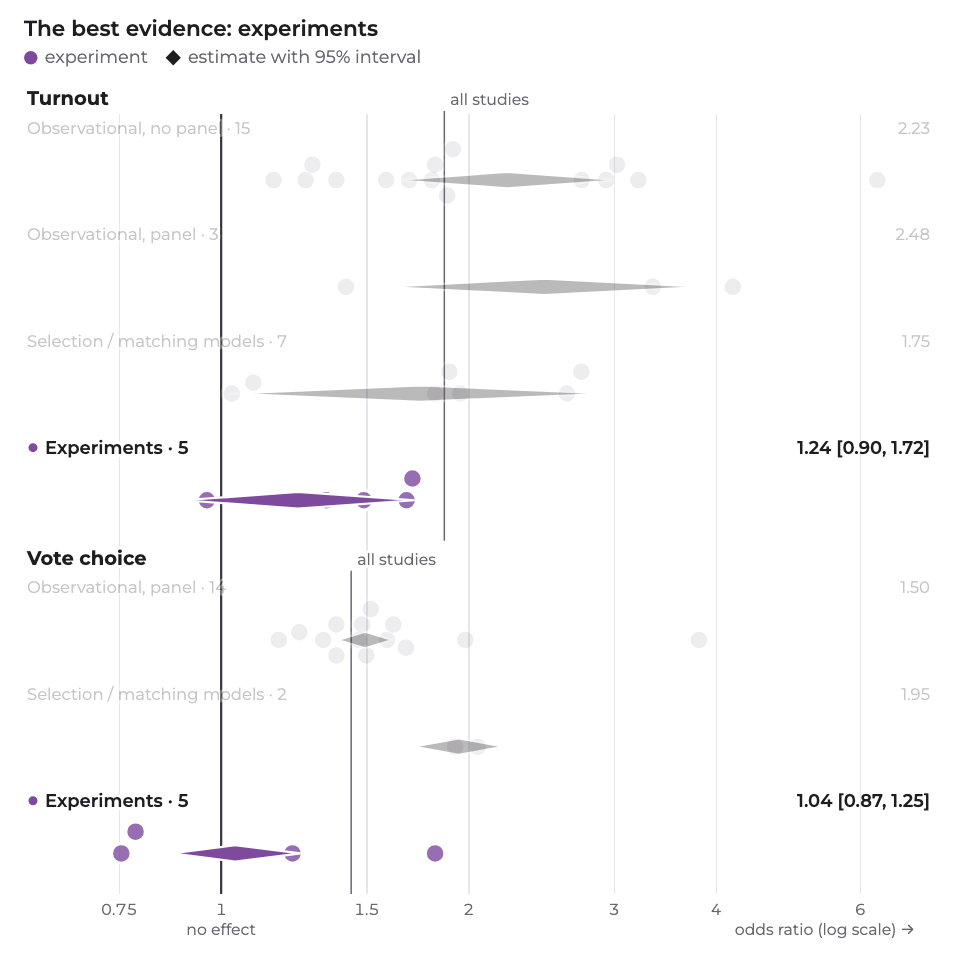
  • Experiments. Researchers randomly encourage some people to use a VAA and not others. Randomization breaks the link between political interest and VAA use.

Watch where the experiments land.

Graphic: The dots move into separate rows by study design. Turnout has four rows: observational without panel (15 effects), observational with panel (3), selection or matching models (7), and experiments (5). Vote choice has three rows: observational with panel (14), selection or matching models (2), and experiments (5). The experimental rows sit noticeably closer to the no-effect line.

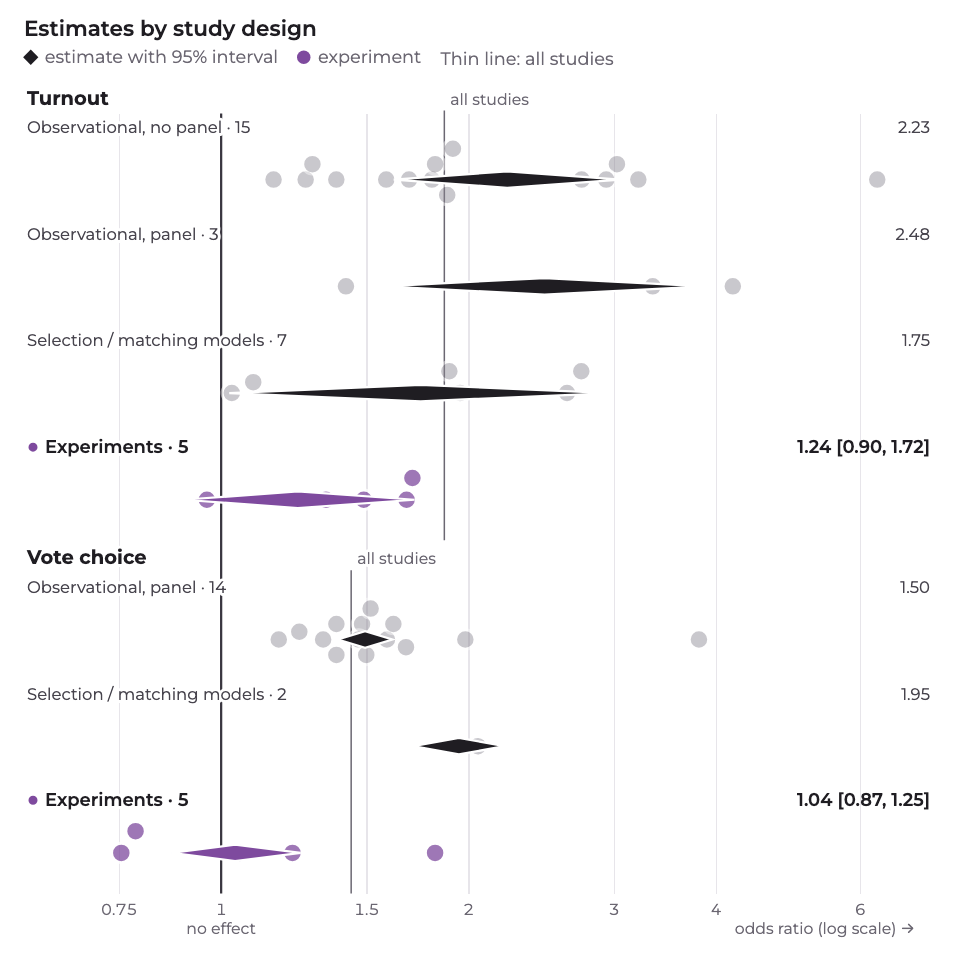
All the observational designs find large effects. Experiments find much smaller ones.

In experiments, the turnout odds ratio is 1.24 (0.90 to 1.72). For vote choice, it is 1.04 (0.87 to 1.25). Both ranges include 1, so neither can be told apart from no effect. For vote choice the range is also narrow, so a large hidden effect is unlikely.

The experimental evidence is still thin: five effects for each outcome, mostly from small samples. But it is the evidence best placed to rule out self-selection.

Graphic: Each design row now has a diamond for its pooled estimate. Turnout: observational designs between 1.75 and 2.48; experiments 1.24, with an interval from 0.90 to 1.72 that crosses 1. Vote choice: observational designs 1.50 and 1.95; experiments 1.04, with an interval from 0.87 to 1.25 that crosses 1. The experimental diamonds are highlighted.

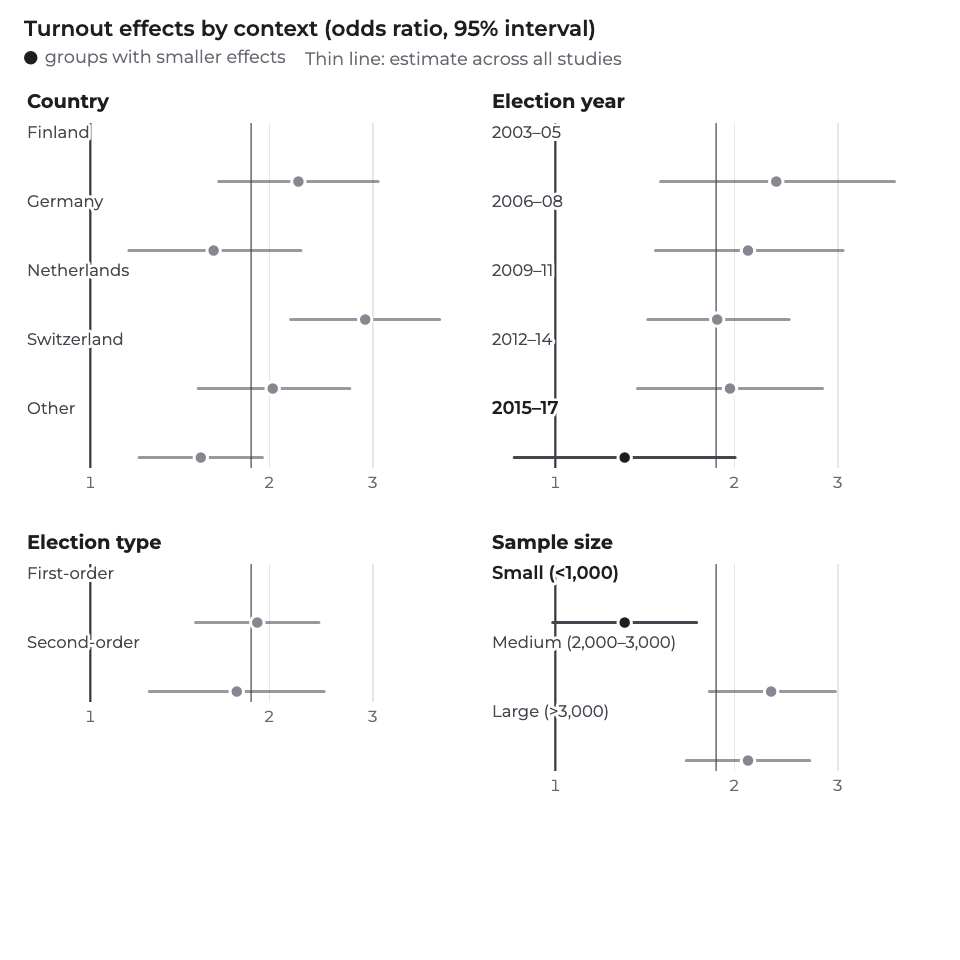
Could something else explain the spread? We checked the country, the election year, whether it was a national election or a "second-order" one like the European Parliament, the sample size, and how the sample was drawn.

Most of these barely move the estimate. Two do: turnout effects are smaller in small samples and in the most recent elections (2015 to 2017). But those are also typical features of the experiments. With this few studies, we can't fully pull the explanations apart.

We also checked whether studies with null results might be missing from the record (publication bias). A standard test, trim-and-fill, found no sign of missing studies.

Graphic: Four small charts for turnout, each showing pooled odds ratios by group: country, election year, election type, and sample size. Most groups sit at similar values, well above 1. Two exceptions stand out: elections from 2015 to 2017, and small samples (under 1,000 people), both closer to 1.

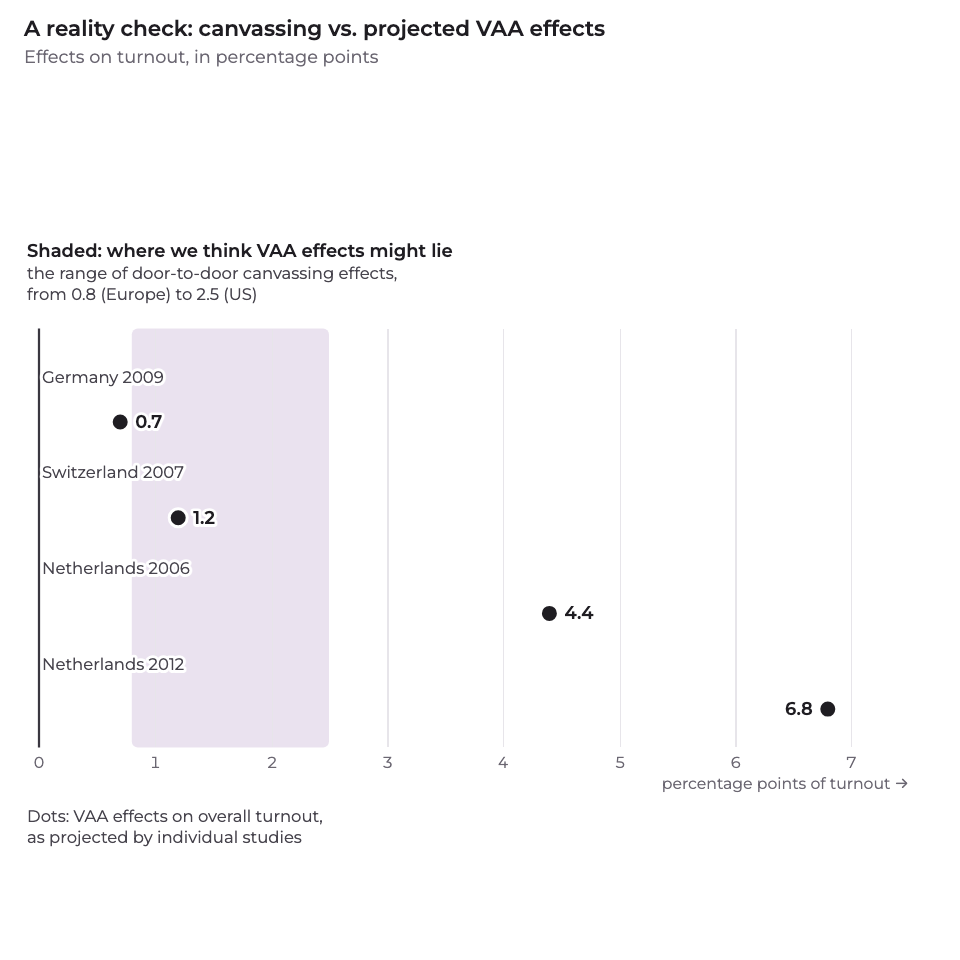
Here is another way to judge these numbers. Compare them with an arguably stronger treatment that scientists have been studying for a while: door-to-door canvassing.

In experiments, canvassing raises turnout among the people it actually reaches by about 0.8 percentage points in European studies and 2.5 in US studies.

Some VAA studies project effects on overall turnout of 0.7 to 6.8 percentage points. The shaded band marks the range of canvassing effects. That is roughly where we think realistic VAA effects might lie.

Most people spend no more than a couple of minutes with a VAA, so not all of these results seem equally plausible to us.

Graphic: A scale in percentage points of turnout. A shaded band from 0.8 to 2.5 points marks the range of door-to-door canvassing effects (European and US studies), labeled as where we think VAA effects might lie. Projected effects of VAAs on overall turnout, from individual studies: 0.7 (Germany 2009) sits just below the band and 1.2 (Switzerland 2007) inside it; 4.4 (Netherlands 2006) and 6.8 (Netherlands 2012) fall well outside it.

So, do VAAs change how people vote? The answer is that it is ambiguous.

Averaged over everything, the effects look large. But self-selection may well have inflated them, and the studies best placed to rule it out find much less.

When we published, here is what we said would settle it:

  • Bigger experiments. Today's are few and small. And even experiments only tell us about the people who take up the encouragement.
  • More work on knowledge. It is the most direct thing a VAA could change, and the least studied.
  • More local and European elections, where voters have less information to go on.
  • More countries. The evidence comes mostly from Germany and the Netherlands. More is needed from other places, including outside the West.

Graphic: Back to the design view. Observational rows are faded. The two experimental estimates are highlighted near the no-effect line: 1.24 for turnout and 1.04 for vote choice.

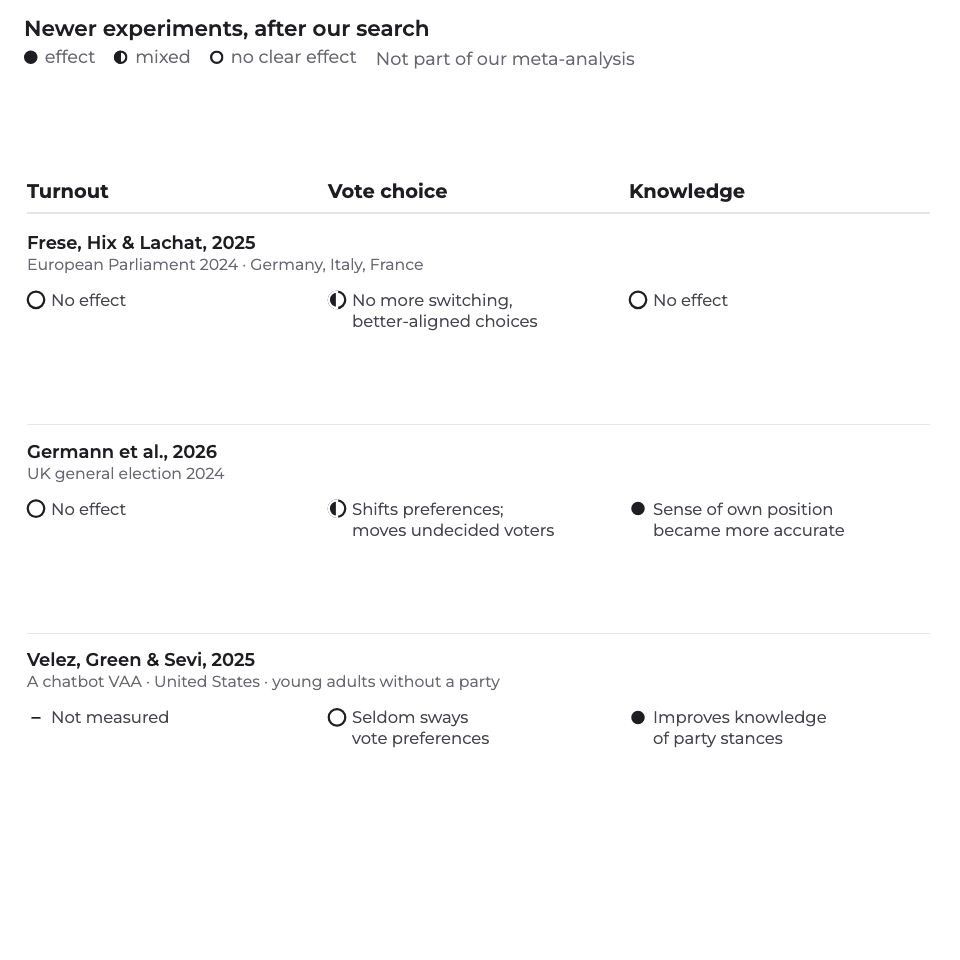
Since our search, researchers have run the kind of experiments we called for. Two stand out, both from 2024 elections.

During the European Parliament elections in Germany, Italy, and France, Frese, Hix, and Lachat ran the highest-powered VAA encouragement experiment to date. They found no effect on turnout, on how often people switched parties, or on political knowledge. But users were more likely to vote for the party the VAA ranked as their best match. The authors read this as better-informed switching, not more of it.

In the UK general election, Germann and colleagues had people use a real VAA as part of a survey experiment, and ran a second experiment inside the VAA itself. Like Frese and colleagues, they found no average effect on vote switching. But once they accounted for the advice each person got, users had moved toward the parties the tool recommended: they saw them as closer to their own views and were more willing to vote for them. These effects shrank over the campaign but were still visible after the election. At the ballot box, the tool moved undecided voters, not those who had already made up their minds. Again, it did not get more people to vote.

Neither finds that VAAs bring more people to the polls. What they may do is help people vote more in line with their own views.

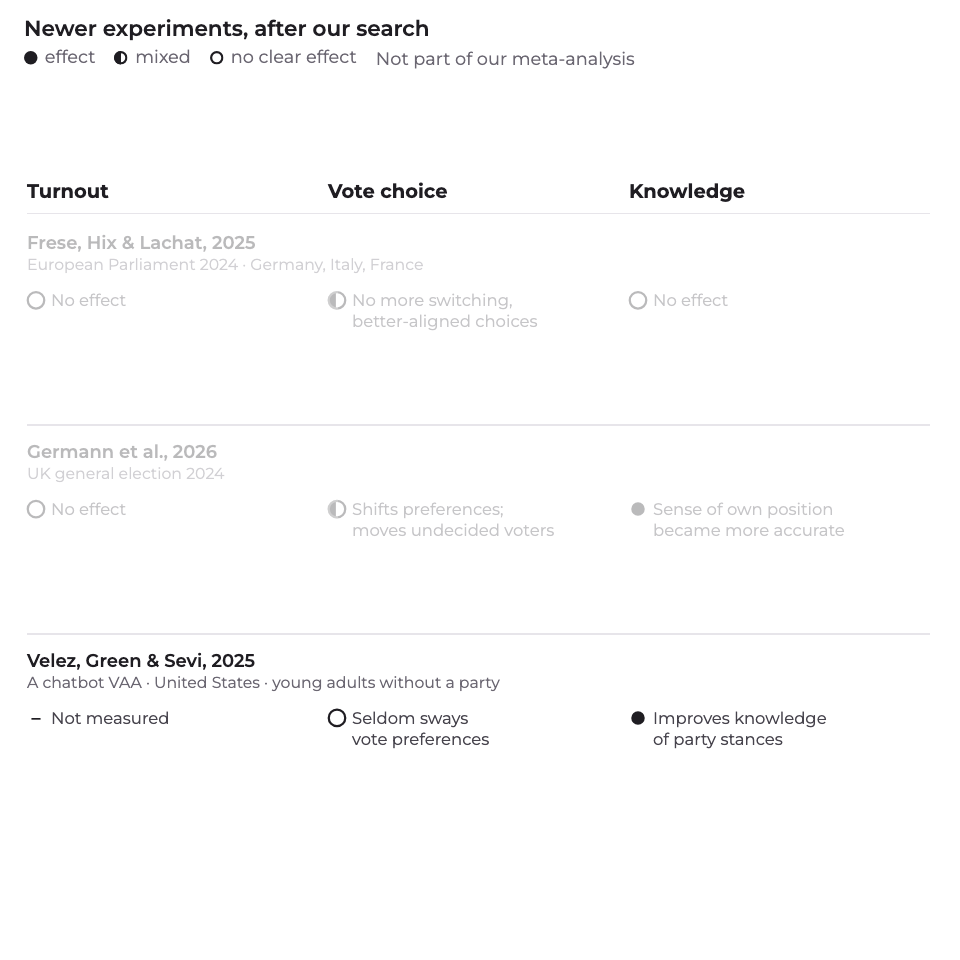
Graphic: A summary table of three newer experiments, not part of our meta-analysis. Frese, Hix, and Lachat (2025), European Parliament elections 2024 in Germany, Italy, and France: no effect on turnout, no more vote switching but better-aligned vote choices, no effect on knowledge. Germann and colleagues (2026), UK general election 2024: no effect on turnout; mixed for vote choice, with party preferences shifting toward the advice and undecided voters moved; knowledge measured differently, as users' sense of how close they are to each party, which became more accurate. Velez, Green, and Sevi (2025), a chatbot VAA tested with young adults in the United States: turnout not measured; seldom sways vote preferences; improves knowledge of party stances.

One more caveat: what counts as a VAA is a moving target. The tools in our data were questionnaires, with a fixed list of statements and a ranking of parties at the end. Today, voters can also ask AI chatbots for advice in an open conversation, and VAAs are starting to change with them.

Early evidence suggests the pattern may hold. In three experiments in the United States, a chatbot VAA built on a large language model helped young adults who identify with neither party learn where the parties stood on the issue they cared about most. The gain was larger than the knowledge gap between college graduates and people without a high-school diploma in their sample. But it barely moved their vote preferences (Velez, Green, and Sevi, 2025).

So VAAs are probably not saviors that will bring non-voters running to the polls. Nor is there evidence that they distort elections. At their best, my spidey-senses say, they help people become better-informed voters. No more, but importantly, no less.

Graphic: The table of newer studies stays on screen. The chatbot VAA row is highlighted: tested in the United States, it improves knowledge of party stances but seldom sways vote preferences.

How we made this

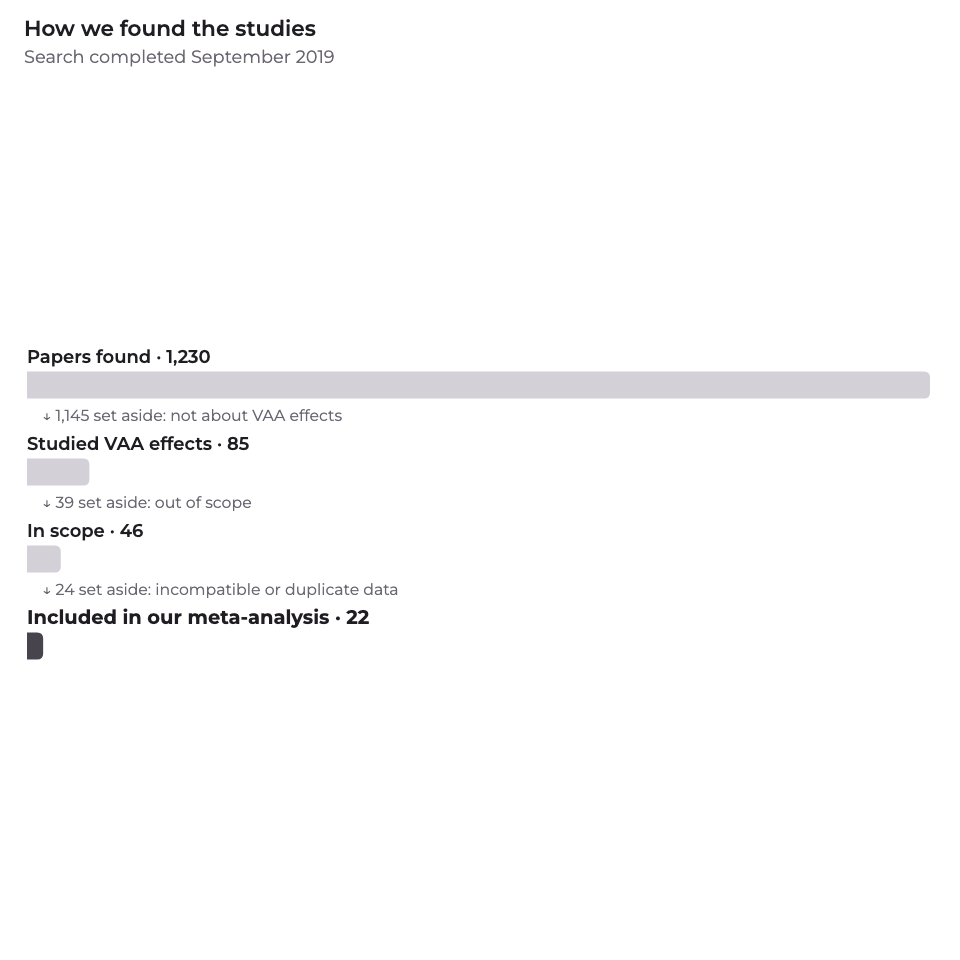
This story is based on our meta-analysis of 55 effects from 22 studies, published in Political Communication in 2021. The search ended in September 2019. The newer studies near the end are not part of the meta-analysis. We summarize them from their full papers. Some context comes from an op-ed we wrote for ZEIT ONLINE in 2021.

Each dot is one effect, placed at its point estimate. Turnout and vote choice are shown as odds ratios on a log scale. Issue knowledge is shown as partial correlations. The pooled estimates come from cross-classified random-effects models (effects nested in studies and elections), estimated by REML with the metafor package for R. We re-estimated every model shown here from the public replication materials. Where the re-run and the paper differ in the last digit, we show the paper's value.

The phone screen, the quiz, and the self-selection diagram are illustrations, not data.

Newer studies mentioned

See all 55 effects in a table

One row per effect, as computed from the replication data: odds ratios for turnout and vote choice, partial correlations for issue knowledge, each with a 95% interval.

OutcomeStudyElectionDesignEstimate [95% CI]
TurnoutEnyedi, 2016Hungary 2010Experiment1.34 [0.99, 1.82]
TurnoutGarzia & De Angelis, 2014Finland 2007Observational, no panel1.69 [1.25, 2.30]
TurnoutGarzia & De Angelis, 2014Finland 2011Observational, no panel1.27 [0.95, 1.70]
TurnoutGarzia & De Angelis, 2014Germany 2009Observational, no panel1.16 [0.82, 1.63]
TurnoutGarzia & De Angelis, 2014Netherlands 2003Observational, no panel1.92 [1.13, 3.25]
TurnoutGarzia & De Angelis, 2014Netherlands 2006Observational, no panel1.59 [1.18, 2.14]
TurnoutGarzia & De Angelis, 2014Netherlands 2010Observational, no panel1.81 [1.38, 2.37]
TurnoutGarzia & De Angelis, 2014Switzerland 2007Observational, no panel1.29 [1.14, 1.47]
TurnoutGarzia & De Angelis, 2014Switzerland 2011Observational, no panel1.38 [1.20, 1.58]
TurnoutGarzia et al., 2017Italy 2013Experiment1.71 [1.27, 2.30]
TurnoutGarzia et al., 2017EU 2009Observational, no panel3.03 [2.45, 3.76]
TurnoutGarzia et al., 2017Finland 2003Observational, no panel3.22 [1.75, 5.92]
TurnoutGarzia et al., 2017Germany 2013Observational, no panel2.94 [1.54, 5.62]
TurnoutGarzia et al., 2017Netherlands 2012Observational, no panel6.30 [3.71, 10.69]
TurnoutGemenis & Rosema, 2014Netherlands 2006Observational, panel4.20 [2.58, 6.83]
TurnoutGemenis, 2018Greece 5/2012Selection / matching2.75 [0.86, 8.73]
TurnoutGemenis, 2018Greece 6/2012Selection / matching2.64 [0.75, 9.25]
TurnoutGemenis, 2018Greece 1/2015Selection / matching1.09 [0.41, 2.92]
TurnoutGemenis, 2018Greece 9/2015Selection / matching1.03 [0.44, 2.39]
TurnoutGermann & Gemenis, 2019Switzerland 2007Selection / matching1.82 [1.26, 2.64]
TurnoutGermann & Gemenis, 2019Switzerland 2011Selection / matching1.95 [1.37, 2.78]
TurnoutGermann & Gemenis, 2019Switzerland 2015Selection / matching1.90 [1.36, 2.65]
TurnoutHeinsohn et al., 2016Germany - EU 2014Observational, panel1.42 [1.19, 1.69]
TurnoutMahéo, 2017Canada 2014Experiment1.49 [0.68, 3.27]
TurnoutMarschall & Schultze, 2012Germany 2009Observational, no panel1.82 [1.12, 2.97]
TurnoutMunzert et al., 2020Germany 2017Experiment0.96 [0.65, 1.42]
TurnoutMykkänen & Moring, 2006Finland - EU 2004Observational, no panel1.89 [1.20, 2.96]
TurnoutMykkänen & Moring, 2006Finland 2003Observational, no panel2.75 [1.74, 4.34]
TurnoutRuusuvirta et al., 2009Netherlands 2006Observational, panel3.35 [2.20, 5.12]
TurnoutVassil, 2012Estonia - EU 2009Experiment1.68 [1.05, 2.69]
Vote choiceAndreadis & Wall, 2014Finland 2003Observational, panel1.98 [1.26, 3.12]
Vote choiceAndreadis & Wall, 2014Finland 2007Observational, panel1.68 [1.09, 2.60]
Vote choiceAndreadis & Wall, 2014Finland 2011Observational, panel1.38 [0.90, 2.11]
Vote choiceAndreadis & Wall, 2014Germany 2009Observational, panel1.48 [1.01, 2.19]
Vote choiceAndreadis & Wall, 2014Netherlands 2003Observational, panel1.25 [0.94, 1.65]
Vote choiceAndreadis & Wall, 2014Netherlands 2006Observational, panel1.52 [1.21, 1.91]
Vote choiceAndreadis & Wall, 2014Netherlands 2010Observational, panel1.47 [1.16, 1.86]
Vote choiceAndreadis & Wall, 2014Switzerland 2007Observational, panel1.18 [0.81, 1.71]
Vote choiceAndreadis & Wall, 2014Switzerland 2011Observational, panel1.38 [1.00, 1.91]
Vote choiceEnyedi, 2016Hungary 2010Experiment1.05 [0.84, 1.32]
Vote choiceKlein Kranenburg, 2015Netherlands 2006Observational, panel1.33 [1.03, 1.72]
Vote choiceKlein Kranenburg, 2015Netherlands 2010Observational, panel1.50 [1.10, 2.05]
Vote choiceKlein Kranenburg, 2015Netherlands 2012Observational, panel1.59 [1.12, 2.27]
Vote choiceKlein Kranenburg, 2015Netherlands 2015Observational, panel1.62 [1.40, 1.87]
Vote choiceKleinnijenhuis et al., 2019Netherlands 2010Observational, panel3.82 [1.38, 10.58]
Vote choiceMahéo, 2016Canada 2014Experiment0.79 [0.44, 1.42]
Vote choiceMunzert et al., 2020Germany 2017Experiment1.22 [0.71, 2.11]
Vote choicePianzola, 2014aSwitzerland 2007Selection / matching2.05 [1.50, 2.81]
Vote choicePianzola, 2014bSwitzerland 2011Selection / matching1.93 [1.67, 2.22]
Vote choicePianzola et al., 2019Switzerland 2011Experiment0.76 [0.40, 1.42]
Vote choiceVassil, 2012Estonia - EU 2009Experiment1.82 [0.83, 3.99]
Issue knowledgeHeinsohn et al., 2016Germany - EU 2014Observational, panel0.08 [0.03, 0.13]
Issue knowledgeMunzert et al., 2020Germany 2017Experiment0.13 [0.07, 0.19]
Issue knowledgeSchultze, 2014Germany 2009Observational, no panel0.19 [0.13, 0.24]
Issue knowledgeVan de Pol, 2016Netherlands 2014Selection / matching−0.04 [−0.07, −0.01]

The paper

Simon Munzert and Sebastian Ramirez-Ruiz (2021). “Meta-Analysis of the Effects of Voting Advice Applications.” Political Communication 38(6), 691–706. DOI: 10.1080/10584609.2020.1843572

← More Research Stories